Ask Your Question
2

How to evaluate light linearity and additivity with a camera

asked 2016-05-25 09:09:12 -0600

theodore gravatar image

updated 2016-05-26 05:26:28 -0600

Hi, lastly I am questioning the linearity and additivity of light propagation in images. As the title says I would like to see what is the contribution of light to image pixel intensity values and if the linearity and additivity of light is a valid assumption to be done or not. For that reason I established the following experiment. Imagine a room , where I set up a camera in top view (i.e. birds eye view) with two light sources of same type and light installed on two of the room corners. Then I took some images where the room was dark, i.e. light sources switched off (really hard to achieve that in reality since always there is gonna be a kind of light that the camera sensor can receive, but lets consider that I managed to do that), then only the first light source was switched on, then only the second light source was switched on and finally when both lights were switched on. These images were captured in rgb 8-bit depth (normal images normal images that can be acquired with a cheap camera sensor) with auto-setting fixed (i.e. exposure, gain, white-balance, etc...). Then I took 500 pixels and plotted their pixel intensity values for a case of one light source, second light source, both light sources and dark:
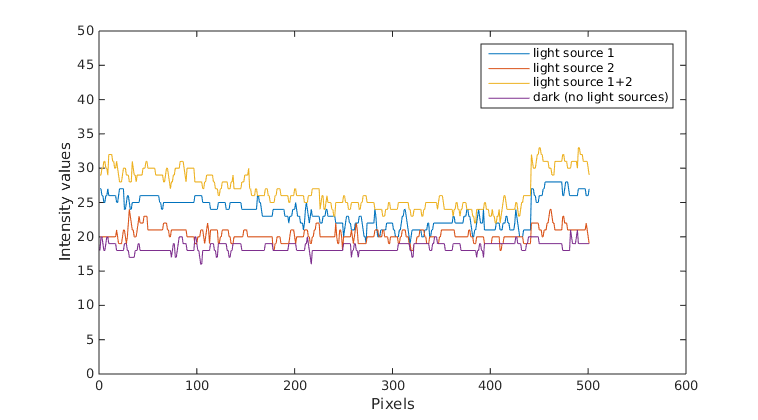
image description

from the above image what you can observe is that I have a lot of noise when the lights are off (purple graph, ideally this should be close to zero). Then if we consider that the light works additive (in the simpler case) then the yellow graph should be as much higher from the blue graph as the blue from the orange graph respectively (again this in the ideal case). However, it is not you can see that in the plot below:
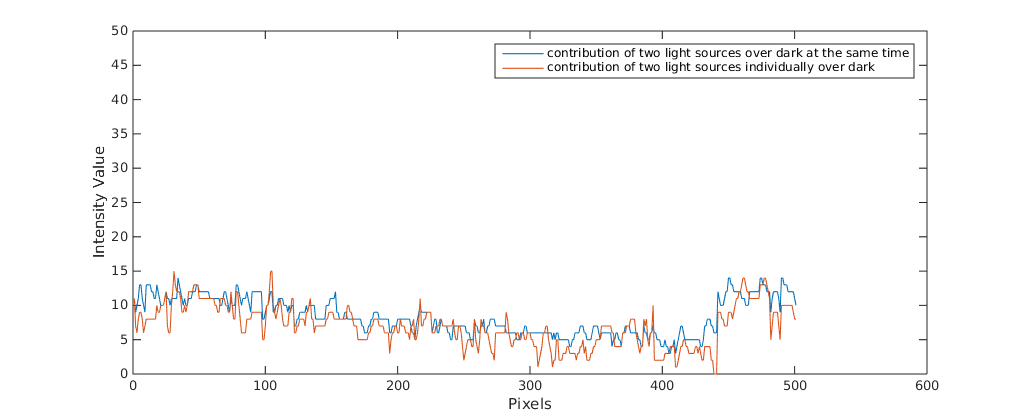
image description

what you see here is

blue graph = yellow - purple (from the first graph)

orange graph = (blue - purple) + (orange - purple)

and these two ideally should be equal if additivity was the case, however we can say that they have a kind of similar pattern. However, it is obvious that what I am doing is not working. Then I searched a bit further and I found this discussion here. Apparently in order to see such a behaviour I need a better camera and to capture pixels values in raw format and in higher bit-depth. To be honest I am not sure if what I am doing makes sense, also I guess that beforehand I need a light calibration procedure with which I am not also familiar. Therefore, my question is if someone has any experience on how to check the above.

@pklab I know that you are working with different camera setups, so I do not know if you have some experience in such a subject. If you have I would be glad to hear any suggestions. Of course anyone that might have a clue is welcome to contribute to the discussion.

Thanks.


Update:

Ok, I did another ...

(more)
edit retag flag offensive close merge delete

Comments

That's not opencv! But it is an interesting problem. You can find many technical defintion using keyword Quantum efficiency (andor website is a good example). About your curve I cannot explain your result except if you have an autoadjust gain. There is some linearity but I don't think it is your case even if you don't cool your ccd...

Finally I'm not sure. Can you use a butterworth filter to reduce noise?

Some smartphone got a luxmeter

LBerger gravatar imageLBerger ( 2016-05-25 09:45:30 -0600 )edit

@LBerger, yes it is not 100 % opencv but more image processing related subject. If the moderators think that it is not relevant, they can close the thread. Which curve do you refer to? Gain was fixed as well during the recording.

theodore gravatar imagetheodore ( 2016-05-25 10:04:04 -0600 )edit

Finally source 1+ source 2 =source 1 and 2 additivity is quite good. You have to reduce noise measurement (first graph). As your signal is same order than noise last graph is not so bad.

If you don't want t use a butterwort filter you can use mean with 500 pixels

LBerger gravatar imageLBerger ( 2016-05-25 10:18:52 -0600 )edit

I agree LBerger. I think you should try the experiments first with stronger light sources. With a high SNR, I don't think you'll get representative results.

In camera image preprocessing also applies some gamma filtering, so results won't be completely linear.

kbarni gravatar imagekbarni ( 2016-05-25 11:35:42 -0600 )edit

thank you both @LBerger and @kbarni, but what if I capture raw format information in bayer or YUV with hight bit-depth. Moreover, how can noise be reduced? intereflections and a little light will always be around (you cannot really achieve total dark, except if you have these clean rooms or under a really controlled environment). Moreover, if we say that the graphs above they kind of show some linearity behaviour. I tried to solve a simple least square linearity problem (I will give some updates tomorrow) where for sure I cannot see any linearity behaviour.

theodore gravatar imagetheodore ( 2016-05-25 17:41:47 -0600 )edit

About the second experiments: I think the system is not linear but logarithmic (just like the sound). In fact the 1.44 is quite close to sqrt(2).

kbarni gravatar imagekbarni ( 2016-05-26 06:18:24 -0600 )edit

@kbarni yes you are right, that was my exact thought. So, then based on my second experiment what I get from the first experiment with the pixel values it makes sense not to show any linearity, right? Since it seems that the pixel values somehow are processed logarithmically and they are not in their actual raw format. Moreover, then comes the other question how to show the linearity of the light over the images.

theodore gravatar imagetheodore ( 2016-05-26 06:57:46 -0600 )edit

What kind of light do you use?

LBerger gravatar imageLBerger ( 2016-05-26 08:56:32 -0600 )edit

it is actually these bulbs.

theodore gravatar imagetheodore ( 2016-05-26 10:17:13 -0600 )edit

Ok it is an alternative light. Have you got a webcam with a framerate 200Hz to check if intensity is constant.

LBerger gravatar imageLBerger ( 2016-05-26 10:21:31 -0600 )edit

3 answers

Sort by ยป oldest newest most voted
2

answered 2016-05-27 11:39:54 -0600

pklab gravatar image

1st it would be nice to open a section on Computer Vision on this forum

@theodore Thank you very much for interesting in my opinion. I'll try to gain this karma

From Quantum Imaging: Linearity? In an ideal linear camera, doubling the light intensity should result in a doubling of the video signal.

Using my bad English... I never had performed this kind of tests but what I know is that the relation between light intensity and signal is expected to be linear with gain K.

pixel_intensity = dark_signal  + Gain * input_photon

This is theoretical and is close to reality for most featured cameras at least for a sub-range of their resolution. In other words linearity is a quality factor for cameras.

See. Characterization and Presentation of Specification Data for Image Sensors and Cameras EUROPEAN MACHINE VISION ASSOCIATION Standard 1288

The linearity of a camera should be one of the specification provided by camera manufacturer. For example see specs for Basler AcA750-30gm Par 4.3.1 and 4.3.6.

From your point of view, you are guessing to verify the linearity of the camera. In other words to do a Photon Transfer Characterization where the camera is the system the light is the input signal and the pixel value is the system output.

This is not so easy because you need of a controlled diffused light emitter at fixed wavelength (otherwise quantum efficiency will produces artefacts) you have to understand/remove the effects of exposure time, type of shutter (global vs rolling) the effects of spatial noise on sensor and finally you have do deduce the linearity as difference of measured signal to noise ratio as suggested by the PTC method.

It would be interesting to see your result if you would use

  • a band pass filter over the lens (choose a band where your cam has max quantum efficiency)
  • many pixels (full image or a ROI or large binning) per frame instead just 1 (I never use 1 pixel because of noise)
  • just 1 light always on
  • change the light received by your camera changing the shutter time
  • get at least N>=10 points for your analysis... I means N different light intensity

    • When shutter=0 you are reading the dark signal (read noise)
    • Get maxShutter when your ROI=255 (avoid local saturation)
    • Set your light points using shutter[i] = i * maxShutter / N

    This would give you a more accurate curve for your estimation

As alternative you can use the Photon Transfer Curve (PTC) method. It's well known and you will find a lot of docs like this or this

edit flag offensive delete link more

Comments

@pklab many thanks once more for your thorough feedback :-). All the information that you mentioned is quite interesting, for some of them I was aware already for some other not. My opinion is that I need first to be sure that my output image is linear. Once you have this linear image I think then you will be able to make more experiments and conclusions. I do not know if you had a look in the two papers that I included in my comments to @LBerger. Especially, the second one is what they do, i.e. exploiting the linearity of the light through the image pixels. I tried to download their dataset, in order to check however they do not share the individual light raw images. Therefore, I will see if I can try to do something similar in the lab that I am working now. To recap I think working with

theodore gravatar imagetheodore ( 2016-05-28 06:13:18 -0600 )edit

raw data and ensuring the linearity of the image I think that I will be able to see the expected result with some minor error of course, since as you also said the most of the cameras guarantee at some level (the more expensive the better, I guess) the linearity of their sensors.

theodore gravatar imagetheodore ( 2016-05-28 06:17:11 -0600 )edit

May be you have a logarithmic sensor. Good tutorial about sensor

You have one model here

May be you have your camera in figure 3

LBerger gravatar imageLBerger ( 2016-05-28 10:08:17 -0600 )edit

I think that the experiment need to be improved. You are working under 20% of full range things could be different at 30%,40%,50%... because your sensor could be semi-linear

  1. disable all available pre-processing settings on your camera like gamma corr, gain, balance... this will produce a RAW image
  2. Instead of adding more lamp modulate the shutter time. This will get you more fine control over input light. (doubling shutter time doubling input light)
  3. get more pixels (a ROI around the centre would be better)
  4. use more points and build get a full range curve of grey vs light
pklab gravatar imagepklab ( 2016-05-28 10:43:30 -0600 )edit

@LBerger and @pklab, I am gonna try different things and see what I get. Thanks again, for your time :-).

theodore gravatar imagetheodore ( 2016-05-30 03:17:12 -0600 )edit

@theodore OK let us know about your result :)

pklab gravatar imagepklab ( 2016-05-30 03:48:37 -0600 )edit
2

answered 2016-06-13 12:07:13 -0600

theodore gravatar image

updated 2016-06-21 10:26:03 -0600

A small fast update since I am in a hurry this period:

First following also the advice of @pklab I checked the linearity of my sensor:

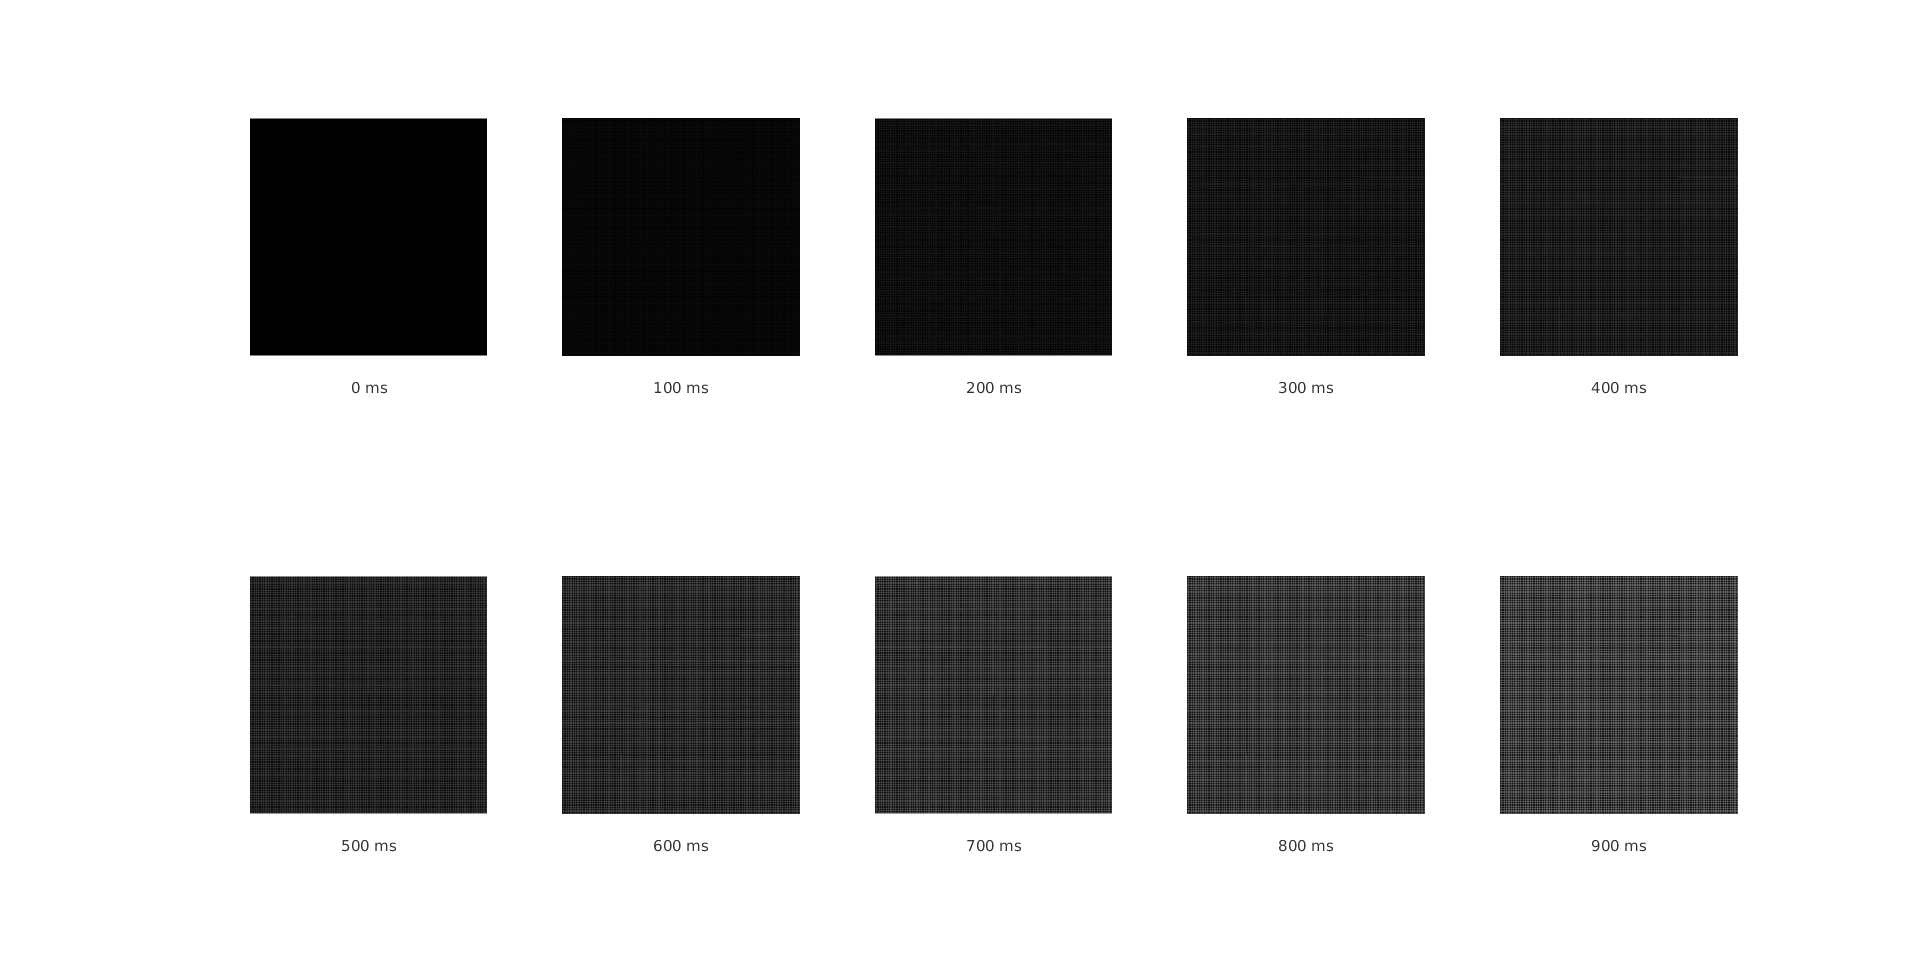
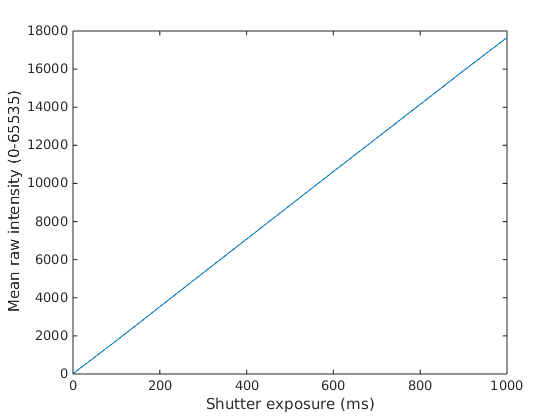
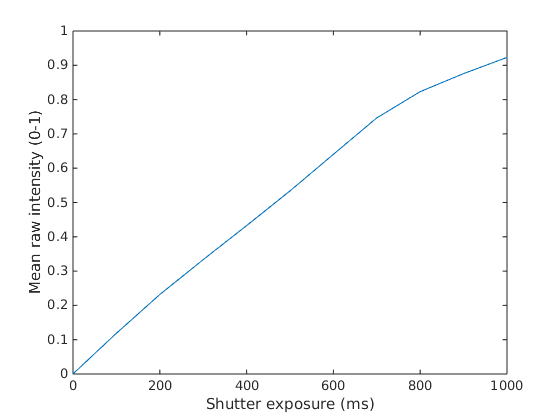
In fixed illumination I got raw format images (16bit, .dng) with different shutter exposure time. Then I took the mean value of a selected roi from the image and I plotted the values in relation to different shutter times.

image description

you can even notice the bayer tiles in the rois above (quite cool :-), I would say).

The result can be seen below:

image description

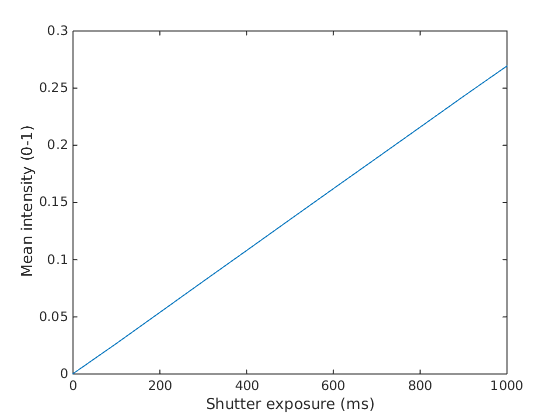
and here with normalized values:

image description

as you can see my sensor is linear.

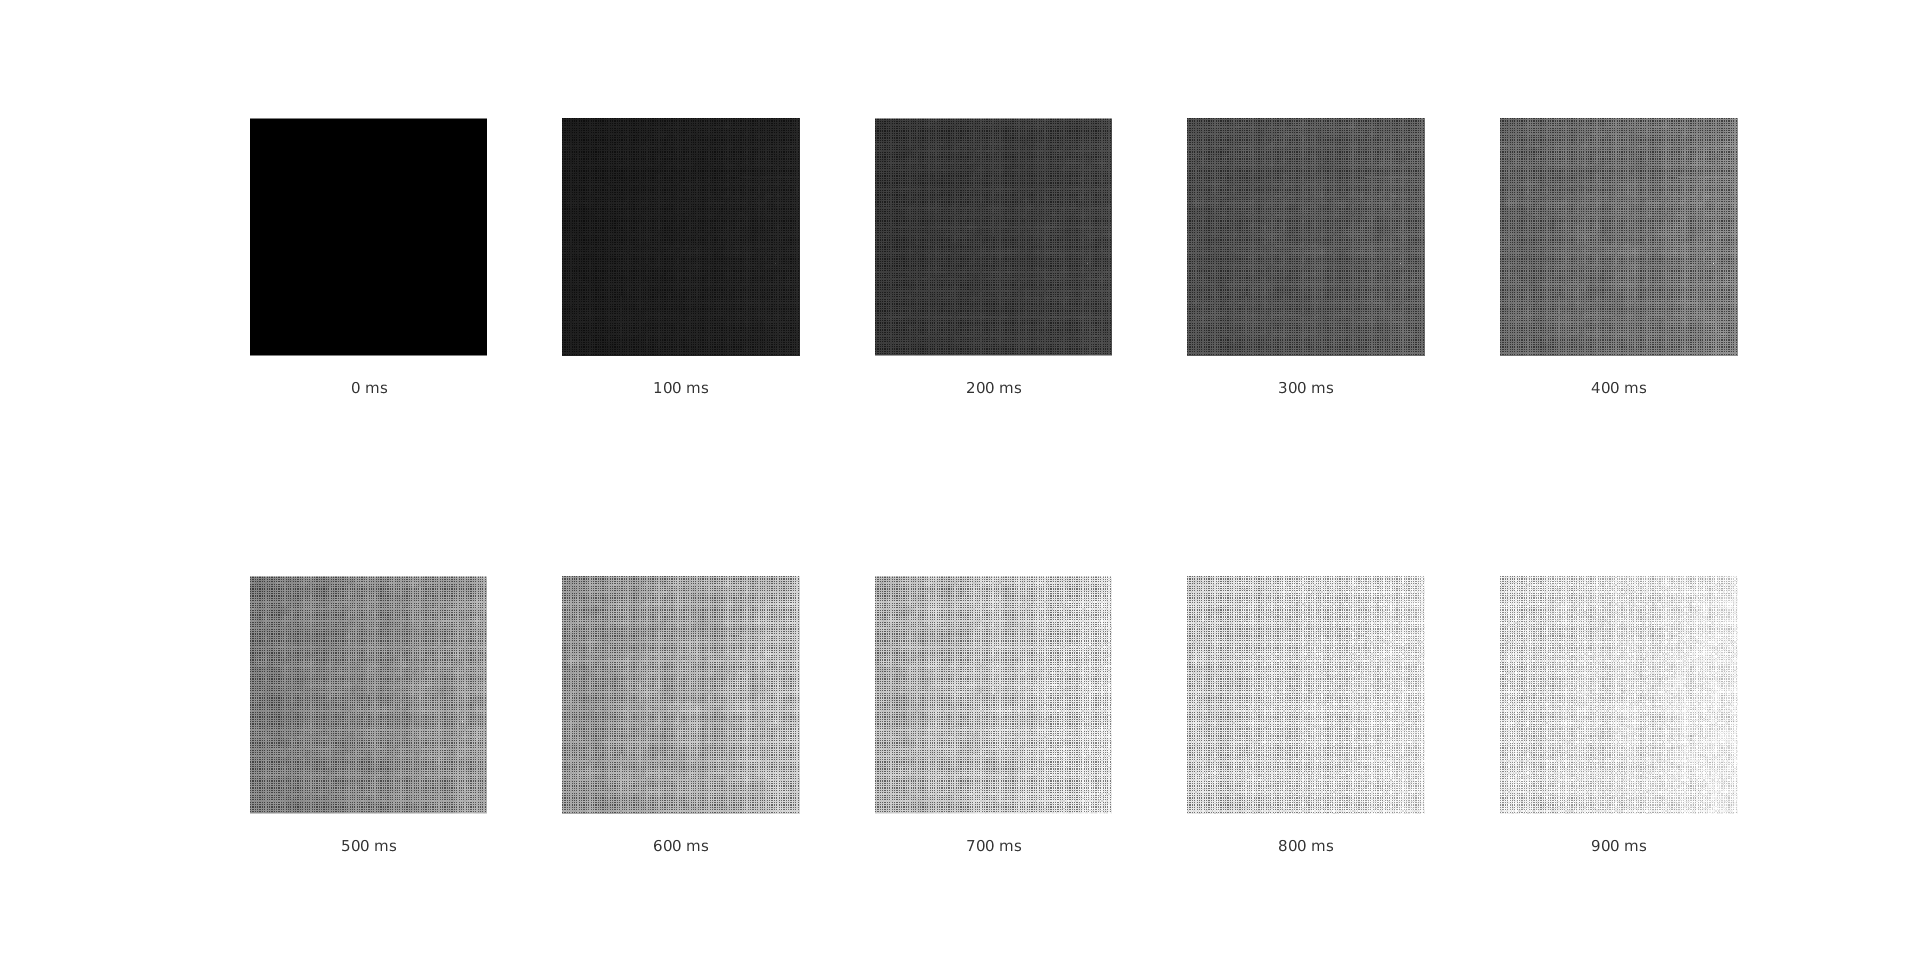
I also did the same experiment with natural light from a window in the lab:

image description

image description

as you can see still performs linearly though the noise, until of course the saturation to start in pixels in a part of the roi (from exporures 800ms and up).

I have also more results to share, and once I find some time again I will keep you posted.

Thanks again both @LBerger and @pklab :-).


Update:

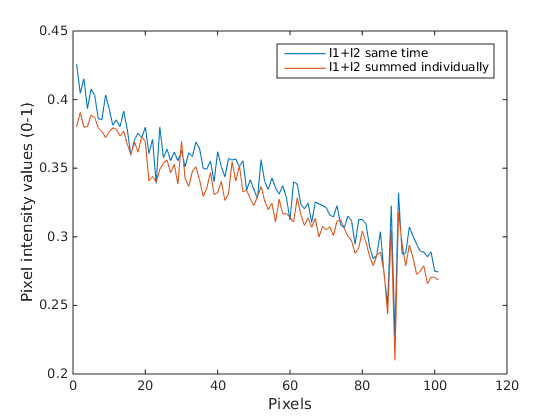
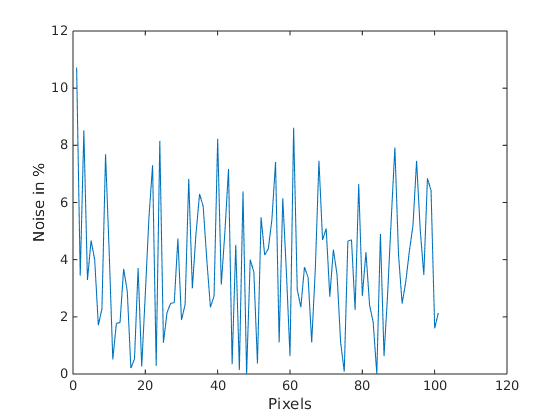
Ok, lets provide some more results regarding the experiments. Now that I am sure that my sensor is linear I did the same experiment as in my initial post. Some frames total dark, some frames with only one light source, some frames with only a second light source and lastly some frames with both lights switched on at the same time. In the ideal case the intensity values of the pixels where both light sources are on should be equal to the summation of the individual ones:

L12 = L1 + L2

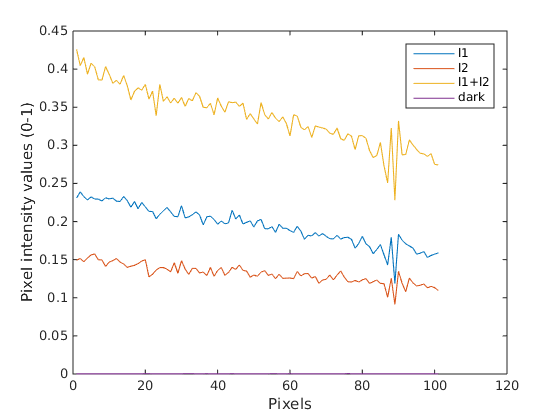
However, due to different types of noise (sensor noise, shot noise, heat noise, etc...), inter-reflections and so on a kind of error it is expected. Below can be seen what I mean in a ROI of 100 pixels:

Here the intensity values of the pixels in each light condition: image description

and here the summed images corresponding to each individual light in comparison to the image where both lights are on at the same time: image description

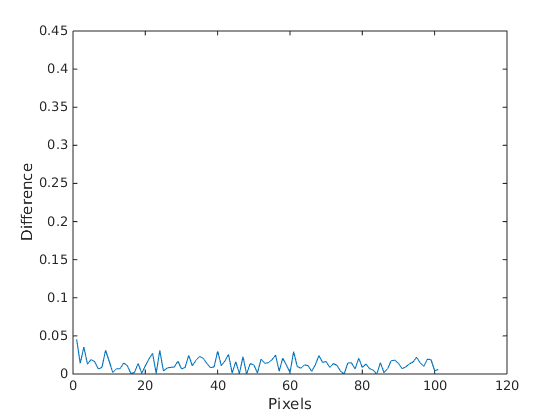
as you can see there is a kind of divergence, which can be better seen in the difference of the above two graphs: image description

if we try to interpret this in percentage we can notice an error of even 10% in some cases: image description

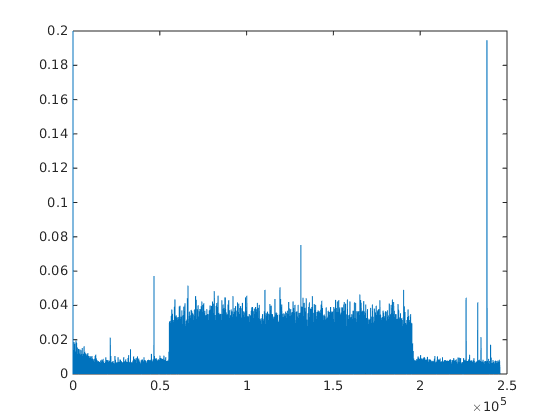
To be honest I found this quite high, but I am not sure if it is. Then I said ok lets see how this is for the whole image:

image description

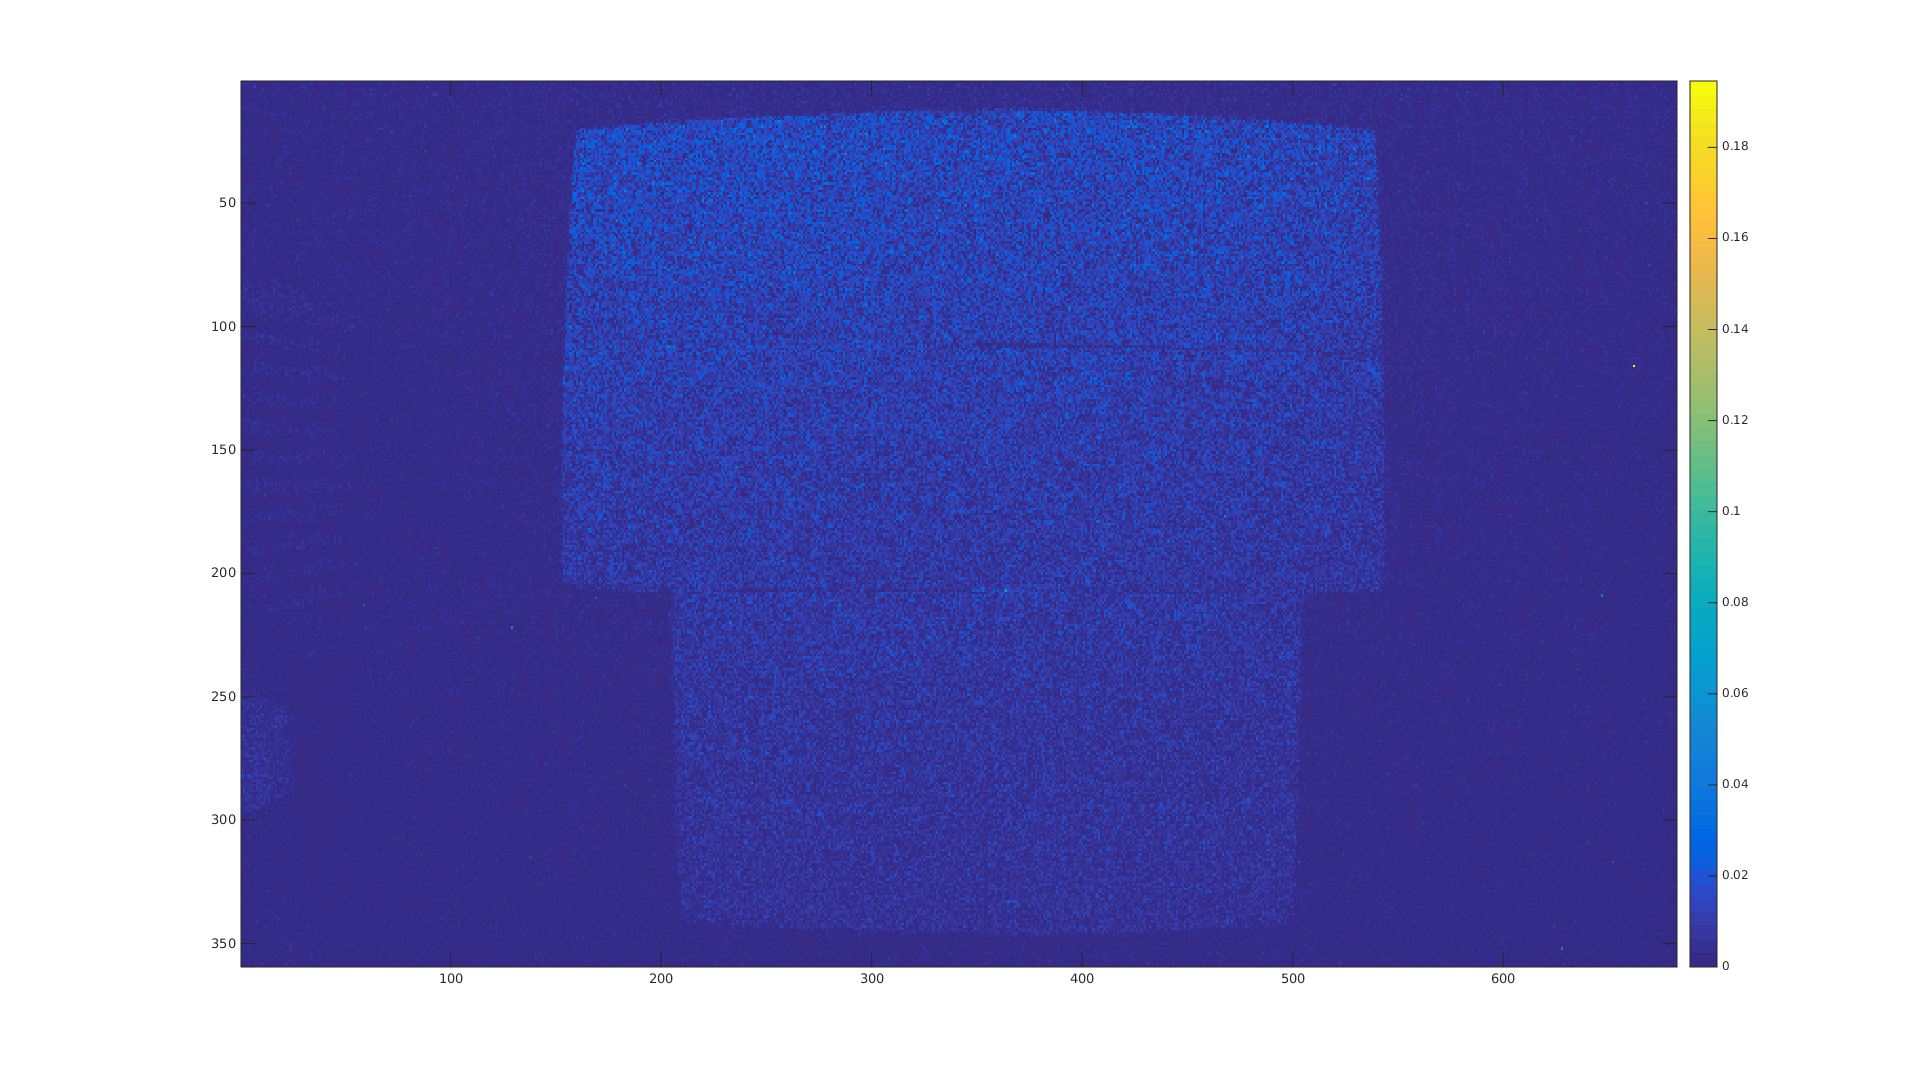
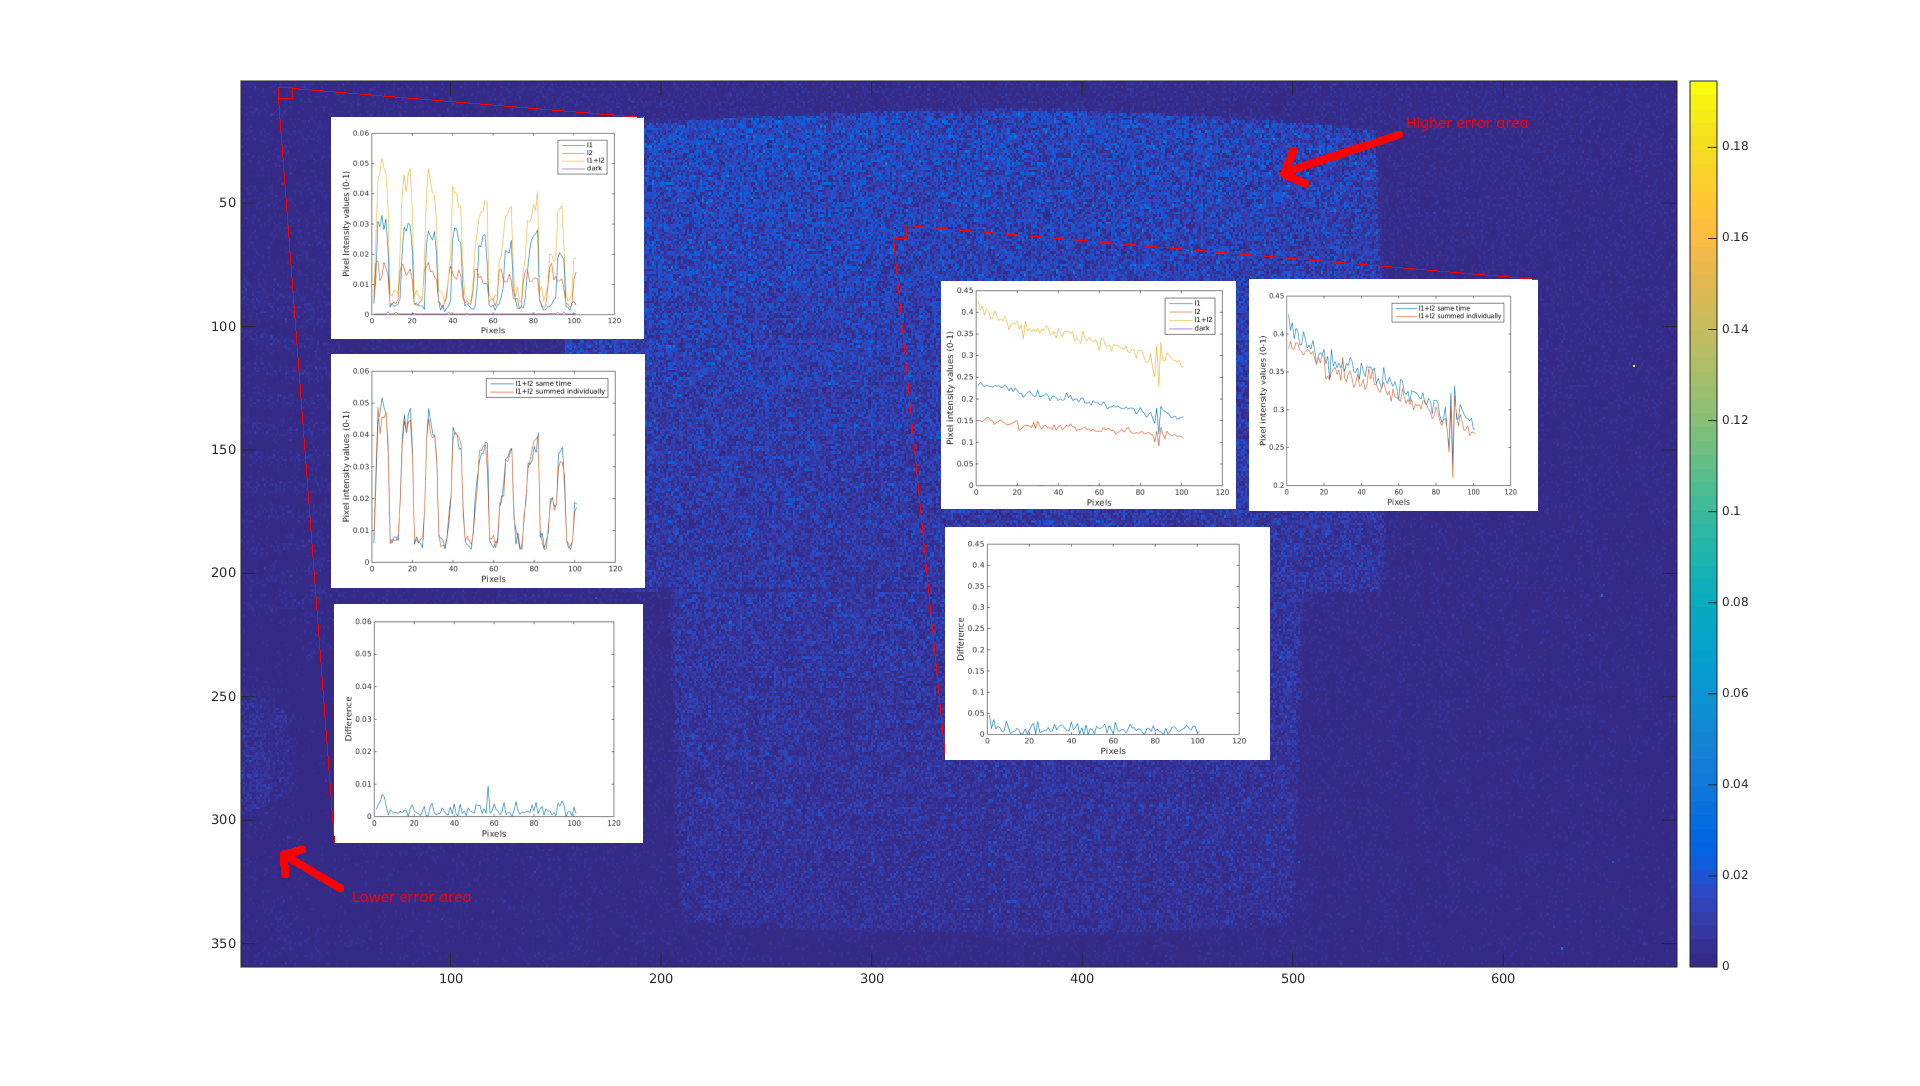
as you can see there a part of the image that has a higher error and actually this is where there is a different object from the rest, which by the way is also brighter from the other which is darker (some individual spikes that can be seen are hot pixels, so no worry about these). The latter can be seen better in the following heatmap:

image description

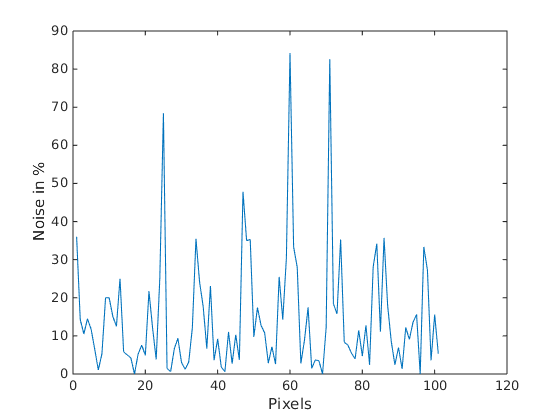
so I calculated the noise in the darker part:

image description

and I noticed that now my noise reached even up to 80% ??????????????

image description

So my question is how this can be ...

(more)
edit flag offensive delete link more

Comments

@theodore Well done, your camera works as expected, bravo !

Just a consideration: your test with ambient light is unacceptable because the light isn't under control. You can use the shutter to control the light that flows on sensor ONLY IF the emitting light is constant. If isn't you have to measure the light received (using a flux meter), and to compare the flux light vs raw intensity keeping the shutter fixed (or introducing the shutter time in your equation)

pklab gravatar imagepklab ( 2016-06-16 12:18:46 -0600 )edit

@pklab thanks for the feedback and sorry for the late response but I am a kind of in a hurry all the last period. Please check also my update, any feedback on it would be great.

theodore gravatar imagetheodore ( 2016-06-21 10:29:04 -0600 )edit

Have you got a progressive scan sensor?

LBerger gravatar imageLBerger ( 2016-06-21 14:23:35 -0600 )edit

Hi Laurent, no I do not have such a sensor. The one that I used was this one.

theodore gravatar imagetheodore ( 2016-06-22 03:35:51 -0600 )edit

Short answer: It seems that your error comes from reflection and not from the camera.

Your heat map shows that objects produces bigger difference. L1, L2 and L1+L2 must have same position otherwise they will produce different reflection ... than result is NOT additive.

Simply brighter/darker pixels are moving because of different incident light angle ... this will produce very high apparent difference between different lamp.

Because is impossible to put L1+L2 at same position of L1 or L2 you need of single controlled light source for accurate measure.

As workaround you can use pixel binning on your camera or decimate the images using ROIs. Binning is preferable. Filter size depends on light positions divergence.

pklab gravatar imagepklab ( 2016-06-22 13:15:15 -0600 )edit

another tips: because you have rolling shutter sensor it's hard to compare accurately neighbour pixels since they are acquired at different time. May be you already know this

pklab gravatar imagepklab ( 2016-06-22 13:18:48 -0600 )edit

Suppose a sensor such that threshold detection is s (photon/second) and c conversion function from photon to volt

c(f)=0 f < s

c(f)=(f-s).k f > s

then c(l1) =(l1-s)k and c(l2)=(l2-s).k and c(l1+l2)=(l1+l2-s). k

c(l1)+c(l2) <> c(l1+l2) Is it good?

LBerger gravatar imageLBerger ( 2016-06-22 13:54:28 -0600 )edit

Philip and Laurent many thanks once more for the feedback. @pklab I did the experiment you proposed since my lights are tunable I used one light source which is in the same position all the time and I just increasing the illumination by measuring the amount with a lux meter (I recorded pictures with range from 0lux (in practice was 0.4) up to 14lux (the higher I could measure with my luxmeter) with a step of 1lux each time). Distance of the lux meter from the source was fixed in all the measurements. So, in theory 10lux = 6lux + 4lux or any other combination that could give me 10lux should correspond also in Pixel_Value12(image taken with 10lux) = Pixel_Value1(image taken with 6lux) + Pixel_Value2(image taken with 4lux). However, I noticed same behavior as previous.

theodore gravatar imagetheodore ( 2016-06-23 08:41:54 -0600 )edit

@LBerger I am not sure I understood exactly what you want to say. Can you elaborate a bit more on your thought. Thanks.

theodore gravatar imagetheodore ( 2016-06-23 08:42:47 -0600 )edit
1

answered 2016-06-07 04:12:45 -0600

LBerger gravatar image

updated 2016-06-11 12:16:21 -0600

Hi,

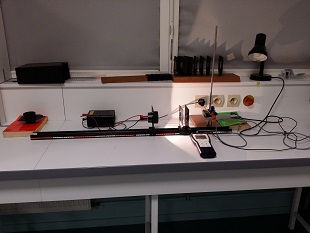
I have try to reproduce your result. I have done this experiment. Experimental and setup is :

image description

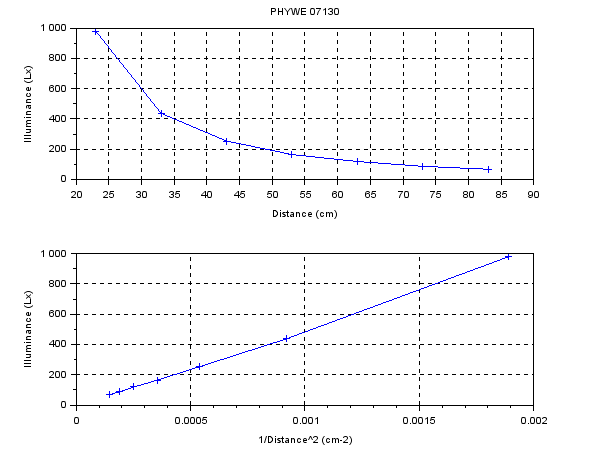
First I use luxmeter to check experimental procedure. Results are good

image description

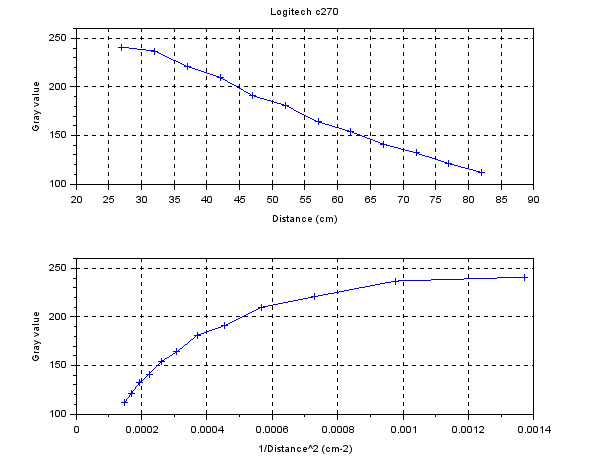
TThen I have done same experiment using my basic webcam :

image description

I should investigate a little because CCD sensivity is linear (sometime logarithmic but I don't think in basic webcam). Problem is in electronics amplification and conversion...

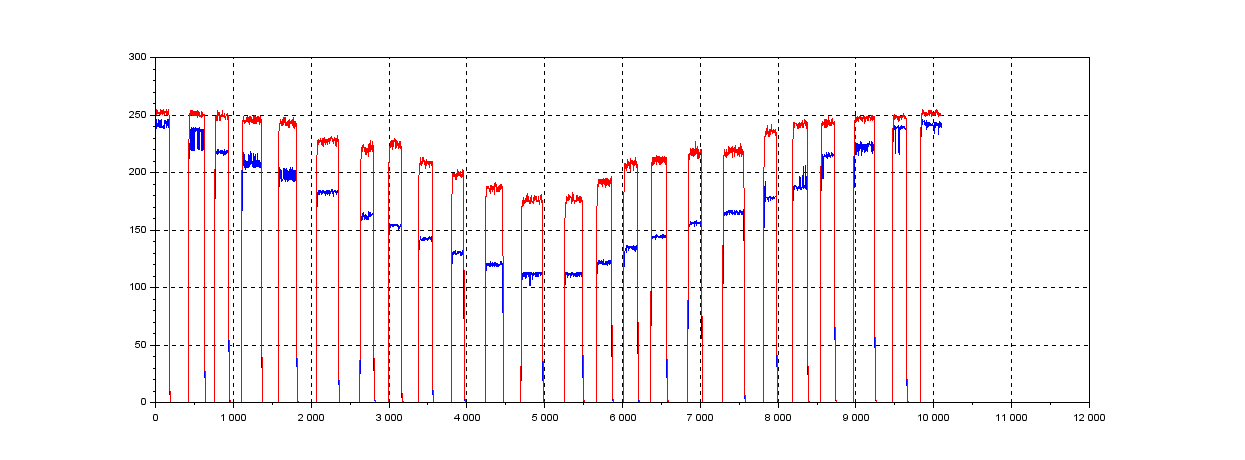
his experiments is a video. Signal versus index file in video is (red curve maximum in each frame blue curve mean around maximum)

image description

You can download video here

edit flag offensive delete link more

Comments

@LBerger thanks for the experiment and sharing your experience. Actually, I also have some new results which I will add here once I get some time.

theodore gravatar imagetheodore ( 2016-06-10 06:30:17 -0600 )edit

@LBerger Sure you had already done needed checks on camera settings. I'm curious to know if you have checked the gray value vs time in special case at short distance. Maybe your camera is making some brightness regulation. Are you sure that your camera is working with a fixed shutter time ?

pklab gravatar imagepklab ( 2016-06-10 13:23:00 -0600 )edit

@LBerger 2 words from you about your last chart would help. What I understood from chart/video is that max-mean increases when light decreases. This suggest that your camera increases some kind of gain when light goes down. This produces some artefacts on your experiment.

pklab gravatar imagepklab ( 2016-06-16 12:29:55 -0600 )edit

@theodore watch this video at 10'40

LBerger gravatar imageLBerger ( 2016-07-01 14:09:28 -0600 )edit

@Laurent I think you forgot to put the link, didn't you? I do no see any link to a video, except if you mean the one in your original post, but this one goes up until 7'.

theodore gravatar imagetheodore ( 2016-07-03 12:21:00 -0600 )edit
LBerger gravatar imageLBerger ( 2016-07-03 12:29:03 -0600 )edit

Question Tools

1 follower

Stats

Asked: 2016-05-25 09:09:12 -0600

Seen: 2,708 times

Last updated: Jun 21 '16