Ask Your Question
4

How to detect peaks on histograms?

asked 2019-01-07 03:55:13 -0600

Many tasks of computer vision produce a histogram and the program must decide whether there is a distinct peak on it, then calculate its parameters such as the height and exact location. This may be tricky. For example if the peak is asymmetrical, taking the maximum may shift location substantially. Another problem is local peaks which should be ignored. I encountered this task in areas not related to vision. Say, in spectroscopy. So there should be extensive research into possible approaches. Can anybody recommend resources for reading?

edit retag flag offensive close merge delete

2 answers

Sort by ยป oldest newest most voted
3

answered 2019-01-07 13:56:51 -0600

updated 2019-01-07 14:03:36 -0600

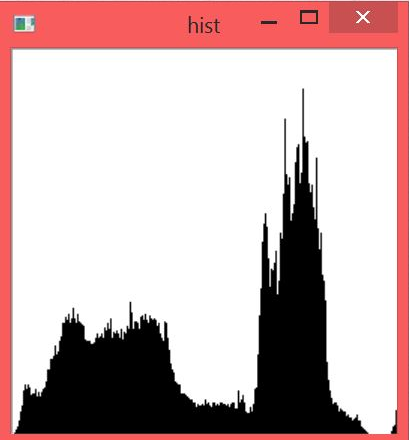
I browsed this forum and no surprise - many people already asked similar questions. I will try and summarize what was accumulated over years because the task is useful. Everything rotates around the definition. What is a peak? The simplest case - just the global maximum. The next approximation - any local maximum that is any bin fitting the condition prev < curr > next.

image description

I use the illustration from http://answers.opencv.org/question/98... You see that this def. will render a lot of false results. An obvious improvement is preprocessing. Namely - smoothing the histogram. Only then it becomes unworkable at all. Smoothed top will be flat so you will get either prev < curr = next or prev = curr = next or prev = curr > next. Anything but the condition in the definition. We can add a shift hist(i - s) < hist(i) > hist(i + s), but then s becomes a parameter which is unknown. All in all the definition of what is peak is task dependent. As a benchmark one can take MatLab findpeaks() function. It requires 2 parameters: minimal distance between peaks and minimal peak height. The first addresses the problem of bimodal peak. We need to exclude local peaks, but in principle all of them are local. Also the task of extracting local maxima pops up in Hough transform so if somebody needs very much, he can look into source code how it is implemented. This is for 2D histogram.

edit flag offensive delete link more
2

answered 2019-01-07 15:50:14 -0600

sjhalayka gravatar image

updated 2019-01-07 15:59:12 -0600

The following is a C++ code to gather the global maximum and draw a circle around it:

vector<float> total_lengths;

// ... fill the vector with data here.

float max_length = 0;

for (size_t i = 0; i < total_lengths.size(); i++)
{
    if (total_lengths[i] > max_length)
        max_length = total_lengths[i];
}

for (size_t i = 0; i < total_lengths.size(); i++)
{
    total_lengths[i] /= max_length;
    total_lengths[i] *= 255.0f;
    total_lengths[i] = floorf(total_lengths[i]);
}

Mat data(1, total_lengths.size(), CV_8UC1, Scalar(0));

for (size_t i = 0; i < total_lengths.size(); i++)
    data.at<unsigned char>(0, i) = static_cast<unsigned char>(total_lengths[i]);

int histSize = 256;
float range[] = { 0, 256 }; //the upper boundary is exclusive
const float* histRange = { range };
bool uniform = true, accumulate = false;
Mat hist;
calcHist(&data, 1, 0, Mat(), hist, 1, &histSize, &histRange, uniform, accumulate);

int hist_w = 600, hist_h = 600;
int bin_w = cvRound((double)hist_w / histSize);
Mat histImage(hist_h, hist_w, CV_8UC3, Scalar(255, 255, 255));
normalize(hist, hist, 0, histImage.rows, NORM_MINMAX, -1, Mat());

float largest_hist = 0;
float largest_hist_j = 0;

for (int j = 0; j < hist.rows; j++)
{
    for (int i = 0; i < hist.cols; i++)
    {
        if (hist.at<float>(j, i) > largest_hist)
        {
            largest_hist = hist.at<float>(j, i);
            largest_hist_j = j;
        }
    }
}

for (int i = 1; i < histSize; i++)
{
    line(histImage, Point(bin_w*(i - 1), hist_h - cvRound(hist.at<float>(i - 1))),
        Point(bin_w*(i), hist_h - cvRound(hist.at<float>(i))),
        Scalar(0, 0, 0), 1, 8, 0);
}

float factor = static_cast<float>(largest_hist_j * bin_w) / static_cast<float>(histImage.cols - 1);
cout << "max value:  " << max_length << endl;
cout << "peak value: " << max_length*factor << endl;

circle(histImage, Point(largest_hist_j * bin_w, 0), 2, Scalar(255, 127, 0), 2);
edit flag offensive delete link more

Question Tools

1 follower

Stats

Asked: 2019-01-07 03:55:13 -0600

Seen: 4,438 times

Last updated: Jan 07 '19