Ask Your Question

Revision history [back]

click to hide/show revision 1
initial version

asked 2018-07-24 02:58:28 -0600

Nbb gravatar image

Help with homography transformation

I am trying to get a top-down view of an image via the homography transformation. I am using the BIWI Walking Pedestrians dataset from http://www.vision.ee.ethz.ch/en/datasets. Inside it you can find a H.txt file containing the 3x3 homography matrix. However, I am unable to get a decent output when applying the homography transformation on the first frame of the video. Below is the output

import numpy as np
import cv2
import matplotlib.pyplot as plt

# read homography matrix
h = []
with open('/home/ast/datasets/ewap/seq_hotel/H.txt', 'r') as f:
    for line in f:
        print(line.strip().split())
        h.append([float(l) for l in line.strip().split()])
h = np.array(h)

# read first image of the video
cap = cv2.VideoCapture('/home/ast/datasets/ewap/seq_hotel/seq_hotel.avi')
_, frame = cap.read()
plt.figure()
plt.imshow(frame)

# transform
im_dst = cv2.warpPerspective(frame, h, (frame.shape[1],frame.shape[0]))
plt.figure()
plt.imshow(im_dst)

And these are the images. You can see that the output is completely black. It is mentioned in the README of the dataset that the positions and velocities are in meters and are obtained with the homography matrix stored in H.txt. I'd assume that the homography matrix must transform the points (and image) from current view to a top down view in order to get the actual position in meters. But am I wrong ? Or have I just applied the function wrongly ?

image description

image description

Help with homography transformation

I am trying to get a top-down view of an image via the homography transformation. I am using the BIWI Walking Pedestrians dataset from http://www.vision.ee.ethz.ch/en/datasets. Inside it you can find a H.txt file containing the 3x3 homography matrix. However, I am unable to get a decent output when applying the homography transformation on the first frame of the video. Below is the output

import numpy as np
import cv2
import matplotlib.pyplot as plt

# read homography matrix
h = []
with open('/home/ast/datasets/ewap/seq_hotel/H.txt', 'r') as f:
    for line in f:
        print(line.strip().split())
        h.append([float(l) for l in line.strip().split()])
h = np.array(h)

# read first image of the video
cap = cv2.VideoCapture('/home/ast/datasets/ewap/seq_hotel/seq_hotel.avi')
_, frame = cap.read()
plt.figure()
plt.imshow(frame)

# transform
im_dst = cv2.warpPerspective(frame, h, (frame.shape[1],frame.shape[0]))
plt.figure()
plt.imshow(im_dst)

And these are the images. You can see that the output is completely black. It is mentioned in the README of the dataset that the positions and velocities are in meters and are obtained with the homography matrix stored in H.txt. I'd assume that the homography matrix must transform the points (and image) from current view to a top down view in order to get the actual position in meters. But am I wrong ? Or have I just applied the function wrongly ?? I have verified that my h array is correct when comparing it to H.txt.

image description

image description

Help with homography transformation

I am trying to get a top-down view of an image via the homography transformation. I am using the BIWI Walking Pedestrians dataset from http://www.vision.ee.ethz.ch/en/datasets. Inside it you can find a H.txt file containing the 3x3 homography matrix. However, I am unable to get a decent output when applying the homography transformation on the first frame of the video. Below is the output

import numpy as np
import cv2
import matplotlib.pyplot as plt

# read homography matrix
h = []
with open('/home/ast/datasets/ewap/seq_hotel/H.txt', 'r') as f:
    for line in f:
        print(line.strip().split())
        h.append([float(l) for l in line.strip().split()])
h = np.array(h)

# read first image of the video
cap = cv2.VideoCapture('/home/ast/datasets/ewap/seq_hotel/seq_hotel.avi')
_, frame = cap.read()
plt.figure()
plt.imshow(frame)

# transform
im_dst = cv2.warpPerspective(frame, h, (frame.shape[1],frame.shape[0]))
plt.figure()
plt.imshow(im_dst)

And these are the images. You can see that the output is completely black. It is mentioned in the README of the dataset that the positions and velocities are in meters and are obtained with the homography matrix stored in H.txt. I'd assume that the homography matrix must transform the points (and image) from current view to a top down view in order to get the actual position in meters. But am I wrong ? Or have I just applied the function wrongly ? I have verified that my h array is correct when comparing it to H.txt.
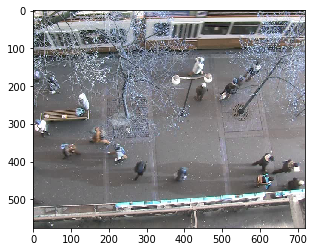
image description

image description

This is the matrix H

[[  1.10482000e-02   6.69589000e-04  -3.32953000e+00]
 [ -1.59660000e-03   1.16324000e-02  -5.39514000e+00]
 [  1.11907000e-04   1.36174000e-05   5.42766000e-01]]

EDIT: So I tried doing the homography transform on the bottom right coordinate of the image [576. 720] and got the result [ 5.69882059 3.33946466]. I think this is the reason why the entire image is black ? because every pixel in the image is mapped to between the coordinate [0,0] to [ 5.69882059 3.33946466] ?

Help with homography transformation

I am trying to get a top-down view of an image via the homography transformation. I am using the BIWI Walking Pedestrians dataset from http://www.vision.ee.ethz.ch/en/datasets. Inside it you can find a H.txt file containing the 3x3 homography matrix. However, I am unable to get a decent output when applying the homography transformation on the first frame of the video. Below is the output

import numpy as np
import cv2
import matplotlib.pyplot as plt

# read homography matrix
h = []
with open('/home/ast/datasets/ewap/seq_hotel/H.txt', 'r') as f:
    for line in f:
        print(line.strip().split())
        h.append([float(l) for l in line.strip().split()])
h = np.array(h)

# read first image of the video
cap = cv2.VideoCapture('/home/ast/datasets/ewap/seq_hotel/seq_hotel.avi')
_, frame = cap.read()
plt.figure()
plt.imshow(frame)

# transform
im_dst = cv2.warpPerspective(frame, h, (frame.shape[1],frame.shape[0]))
plt.figure()
plt.imshow(im_dst)

And these are the images. You can see that the output is completely black. It is mentioned in the README of the dataset that the positions and velocities are in meters and are obtained with the homography matrix stored in H.txt. I'd assume that the homography matrix must transform the points (and image) from current view to a top down view in order to get the actual position in meters. But am I wrong ? Or have I just applied the function wrongly ? I have verified that my h array is correct when comparing it to H.txt.

image description

image description

This is the matrix H

[[  1.10482000e-02   6.69589000e-04  -3.32953000e+00]
 [ -1.59660000e-03   1.16324000e-02  -5.39514000e+00]
 [  1.11907000e-04   1.36174000e-05   5.42766000e-01]]

EDIT: So I tried doing the homography transform on the bottom right and top left coordinate of the image [0,0] and [576. 720] and got the result [-6.13437462 -9.94008446] and [ 5.69882059 3.33946466]. I think this is the reason why the entire image is black ? because every pixel in the image is mapped to between the coordinate [0,0] [-6.13437462 -9.94008446] to [ 5.69882059 3.33946466] ?? (1) All pixels mapped to the negative side do not appear in the image and (2) the range is too small. I think what I will try is to scale each pixel individually e.g. they get mapped to centimeters instead of meters

Help with homography transformation

I am trying to get a top-down view of an image via the homography transformation. I am using the BIWI Walking Pedestrians dataset from http://www.vision.ee.ethz.ch/en/datasets. Inside it you can find a H.txt file containing the 3x3 homography matrix. However, I am unable to get a decent output when applying the homography transformation on the first frame of the video. Below is the output

import numpy as np
import cv2
import matplotlib.pyplot as plt

# read homography matrix
h = []
with open('/home/ast/datasets/ewap/seq_hotel/H.txt', 'r') as f:
    for line in f:
        print(line.strip().split())
        h.append([float(l) for l in line.strip().split()])
h = np.array(h)

# read first image of the video
cap = cv2.VideoCapture('/home/ast/datasets/ewap/seq_hotel/seq_hotel.avi')
_, frame = cap.read()
plt.figure()
plt.imshow(frame)

# transform
im_dst = cv2.warpPerspective(frame, h, (frame.shape[1],frame.shape[0]))
plt.figure()
plt.imshow(im_dst)

And these are the images. You can see that the output is completely black. It is mentioned in the README of the dataset that the positions and velocities are in meters and are obtained with the homography matrix stored in H.txt. I'd assume that the homography matrix must transform the points (and image) from current view to a top down view in order to get the actual position in meters. But am I wrong ? Or have I just applied the function wrongly ? I have verified that my h array is correct when comparing it to H.txt.

image description

image description

This is the matrix H

[[  1.10482000e-02   6.69589000e-04  -3.32953000e+00]
 [ -1.59660000e-03   1.16324000e-02  -5.39514000e+00]
 [  1.11907000e-04   1.36174000e-05   5.42766000e-01]]

EDIT: So I tried doing the homography transform on the bottom right and top left coordinate of the image [0,0] and [576. 720] and got the result [-6.13437462 -9.94008446] and [ 5.69882059 3.33946466]. I think this is the reason why the entire image is black ? because every pixel in the image is mapped to between the coordinate [-6.13437462 -9.94008446] to [ 5.69882059 3.33946466] ? (1) All pixels mapped to the negative side do not appear in the image and (2) the range is too small. I think what I will try is to scale each pixel individually e.g. they get mapped to centimeters instead of metersmeters and to also translate all points to make them all non negative

Help with homography transformation

I am trying to get a top-down view of an image via the homography transformation. I am using the BIWI Walking Pedestrians dataset from http://www.vision.ee.ethz.ch/en/datasets. Inside it you can find a H.txt file containing the 3x3 homography matrix. However, I am unable to get a decent output when applying the homography transformation on the first frame of the video. Below is the output

import numpy as np
import cv2
import matplotlib.pyplot as plt

# read homography matrix
h = []
with open('/home/ast/datasets/ewap/seq_hotel/H.txt', 'r') as f:
    for line in f:
        print(line.strip().split())
        h.append([float(l) for l in line.strip().split()])
h = np.array(h)

# read first image of the video
cap = cv2.VideoCapture('/home/ast/datasets/ewap/seq_hotel/seq_hotel.avi')
_, frame = cap.read()
plt.figure()
plt.imshow(frame)

# transform
im_dst = cv2.warpPerspective(frame, h, (frame.shape[1],frame.shape[0]))
plt.figure()
plt.imshow(im_dst)

And these are the images. You can see that the output is completely black. It is mentioned in the README of the dataset that the positions and velocities are in meters and are obtained with the homography matrix stored in H.txt. I'd assume that the homography matrix must transform the points (and image) from current view to a top down view in order to get the actual position in meters. But am I wrong ? Or have I just applied the function wrongly ? I have verified that my h array is correct when comparing it to H.txt.

image description

image description

This is the matrix H

[[  1.10482000e-02   6.69589000e-04  -3.32953000e+00]
 [ -1.59660000e-03   1.16324000e-02  -5.39514000e+00]
 [  1.11907000e-04   1.36174000e-05   5.42766000e-01]]

EDIT: So I tried doing the homography transform on the bottom right and top left coordinate of the image [0,0] and [576. 720] and got the result [-6.13437462 -9.94008446] and [ 5.69882059 3.33946466]. I think this is the reason why the entire image is black ? because every pixel in the image is mapped to between the coordinate [-6.13437462 -9.94008446] to [ 5.69882059 3.33946466] ? (1) All pixels mapped to the negative side do not appear in the image and (2) the range is too small. I think what I will try is to scale each pixel individually e.g. they get mapped to centimeters instead of meters and to also translate all points to make them all non negative

EDIT: Well I tried to project each points individually but I think the output is not satisfactory. What can I do to the homography matrix such that the output of warpperspective is in centimeters instead of meters.

# offset matrix for the hotel sequence
offset_hotel = np.array([[1,0,10], [0,1,10], [0,0,1]], dtype="float32")

# generate image coordinates
im_coordinates = []
for y in range(np.shape(frame)[0]):
    for x in range(np.shape(frame)[1]):        
        im_coordinates.append([y,x])
im_coordinates = np.array([im_coordinates], dtype = "float32")

# convert to world coordinates (centimeters)
world_coordinates = 100*cv2.perspectiveTransform(im_coordinates, offset_hotel@h)

# get limits of world coordinates
max_y = 0
max_x = 0
for w in world_coordinates[0]:
    y = w[0]
    x = w[1]    
    if(y >= max_y):
        max_y = y        
    if(x >= max_x):
        max_x = x        
print(max_y, max_x)

# print limits
print("limits: ", max_y, max_x)

# # prepare birds-eye view canvas
im_topview = np.zeros(shape=(np.round(max_y)+1, np.round(max_x)+1, 3), dtype="uint8")
print(np.shape(im_topview))

# read video and get the first frame
cap = cv2.VideoCapture('/home/ast/datasets/ewap/seq_hotel/seq_hotel.avi')
_, frame = cap.read()
plt.figure()
plt.imshow(frame)

# for each pixel of the frame
for y in range(np.shape(frame)[0]):
    for x in range(np.shape(frame)[1]): 

        wc = world_coordinates[0,720*y + x]
        im_topview[int(np.round(wc[0])), int(np.round(wc[1]))] = frame[y,x]

# # im_dst = cv2.warpPerspective(frame, M=h, dsize=(frame.shape[1],frame.shape[0]))
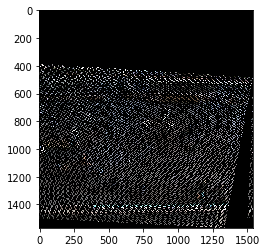

image description