Ask Your Question
2

Finding Bimodal Peak in Histogram

asked 2016-05-16 03:20:17 -0600

zms gravatar image

updated 2016-05-17 12:12:02 -0600

pklab gravatar image

Hi, I'm trying to get the peak for a bimodal histogram. Here is the code and i just could not filter the last two

int number=0;
int size=0;
for (int i=1; i<256-1;++i) 
{ if(histoheight[i]>histoheight[i-1] && histoheight[i]>histoheight[i+1])
{ 
 cout << "Peak Index: " <<i << " Peak Value: " <<histoheight[i] <<endl;
}
}

Output:

Peak Index: 133 Peak Value: 40
Peak Index: 143 Peak Value: 318
Peak Index: 145 Peak Value: 373
**Peak Index: 147 Peak Value: 400**
Peak Index: 150 Peak Value: 306
Peak Index: 152 Peak Value: 238
Peak Index: 159 Peak Value: 87
Peak Index: 163 Peak Value: 49
Peak Index: 166 Peak Value: 39
Peak Index: 168 Peak Value: 40
Peak Index: 172 Peak Value: 20
Peak Index: 174 Peak Value: 17
Peak Index: 176 Peak Value: 15
Peak Index: 178 Peak Value: 14
Peak Index: 181 Peak Value: 12
Peak Index: 186 Peak Value: 10
Peak Index: 198 Peak Value: 11
Peak Index: 207 Peak Value: 9
Peak Index: 211 Peak Value: 9
Peak Index: 221 Peak Value: 9
Peak Index: 228 Peak Value: 10
Peak Index: 233 Peak Value: 11
Peak Index: 235 Peak Value: 12
Peak Index: 242 Peak Value: 16
**Peak Index: 250 Peak Value: 18**

The two peak is there where the condition are 1) when Peak Index is the smallest and Peak Value is the highest 2) when Peak Index is the highest and Peak Value is the highest

How to include this in the code? Thanks for the help

edit retag flag offensive close merge delete

1 answer

Sort by ยป oldest newest most voted
4

answered 2016-05-16 04:47:46 -0600

pklab gravatar image

updated 2016-05-17 12:11:25 -0600

You can smooth the histogram to catch only major peaks

GaussianBlur(hist, histSmoothed, Size(9,9), 0, 0, BORDER_REPLICATE);

This operation removes noise and small variation over histogram... as is expected by GaussianBlur. You can also reduce the num of bins to achieve similar result.

You can play with the code below to analyse your histogram. Here is my result smoothSize=9
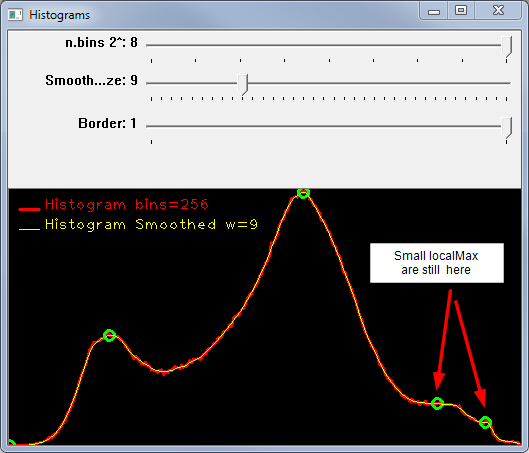
image description]

All relevant peaks are kept according to smooth size. You can reduce smalls localMax increasing smoothSize=17 or reduce the num of bins... this case uses 16 bins
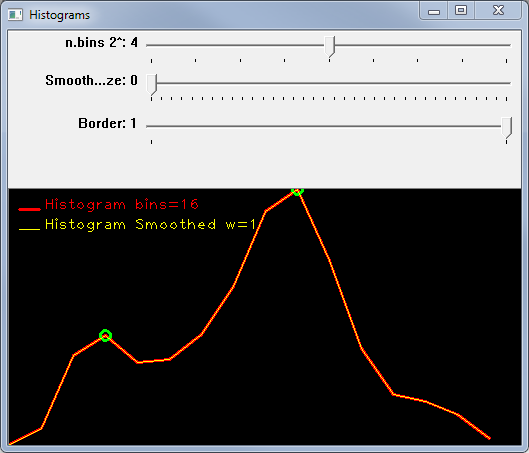
image description

BTW, to use your algorithm for peaks detection you have to be sure that the histogram is bimodal. Otherwise you have to use a more complicated peak detection, for example you should measure the power of the peak or at least its width. Use tag peaks on this site to locate examples like this

This is the code for smoothing numBins and plot.... enjoy !

#define CL_RED Scalar(0,0,255)
#define CL_GREEN Scalar(0,255,0)
#define CL_YELLOW Scalar(0,255,255    )

int smoothSize = 7;
int numBins = 8;
int borderType = BORDER_REPLICATE;
std::string winName = "Histograms";
Mat grayImg;

//HELPER FUNCTIONS
struct histSerie {
    Mat hist;
    std::string Title;
    Scalar lineColor;
    int lineWidth;
    bool drawLocalMax;
    histSerie(std::string _Title = "", Mat _hist = Mat(),
        Scalar _lineColor = Scalar(255, 0, 0), bool _drawLocalMax = false, int _lineWidth = 1) :
        Title(_Title), lineColor(_lineColor), lineWidth(_lineWidth), 
        drawLocalMax(_drawLocalMax)  {_hist.copyTo(hist); }
};
void PlotHistSeries(const vector<histSerie> &histSeries, Mat &plotResult,
    Scalar bgColor = Scalar(0, 0, 0));
void onTrackBar(int, void*);
// MAIN
int main(int argc, char* argv[])
{
    Mat src;
    src = imread("stones.jpg");
    if (!src.data) return -1;
    cvtColor(src, grayImg, CV_BGR2GRAY);
    imshow("Src image", grayImg);
    namedWindow(winName);
    createTrackbar("n.bins 2^", winName, &numBins, 8, onTrackBar);
    createTrackbar("Smooth Size", winName, &smoothSize, 35, onTrackBar);
    createTrackbar("Border", winName, &borderType, BORDER_REPLICATE, onTrackBar);
    onTrackBar(0, 0);
    waitKey(0);
    return 0;
}

void onTrackBar(int, void*)
{
    Mat hist, histSmoothed, plotResult;
    vector<histSerie> histSeries;
    //enable this if you want to draw over srcImage
    //cvtColor(grayImg, plotResult, CV_GRAY2BGR);

    //Create the histogram
    float range[] = { 0, 256 };
    const float* histRange = { range };
    int histSize = pow(2, numBins);
    calcHist(&grayImg, 1, 0, Mat(), hist, 1, &histSize, &histRange, true, false);
    histSeries.push_back(histSerie("Histogram bins=" + to_string(histSize), 
            hist, CL_RED, false, 2));

    //smooth the histogram
    if ((smoothSize % 2) == 0) smoothSize += 1;  //use odd value
    Size sz(smoothSize, smoothSize);
    GaussianBlur(hist, histSmoothed, sz, 0, 0, borderType);
    histSeries.push_back(histSerie("Histogram Smoothed w=" + to_string(smoothSize),
        histSmoothed, CL_YELLOW, true));
    //Plot and show the result
    PlotHistSeries(histSeries, plotResult);
    imshow(winName, plotResult);
}

void PlotHistSeries(const vector<histSerie> &histSeries, Mat &plotResult, Scalar bgColor)
{
    double maxOfMax = 0;
    int histSize = 0;
    for (int s = 0; s < histSeries.size(); s++) {
        histSize = max(histSize, histSeries[s].hist.size().height);
        double minVal, maxVal;
        minMaxLoc(histSeries[s].hist, &minVal, &maxVal);
        maxOfMax = max(maxOfMax, maxVal);
    }
    //create the plot image
    if (plotResult.empty())
        plotResult = Mat(256, 512, CV_8UC3, bgColor);
    //calculate y scale
    double yScale = (double)plotResult.size().height / maxOfMax;
    double xScale = (double)plotResult.size().width / histSize;
    // Draw all histograms
    for (int s = 0; s < histSeries.size(); s++) {
        Mat ...
(more)
edit flag offensive delete link more

Comments

@pklab. Actually I had use the gaussian filter.. yet it is actually not as smooth as i wanted yet it did help to filter the other. Here is the code i had been used in the program

  Mat src, dst;
  /// Load image
  src = imread( "c:\\diff\\pic1.jpg", 1 );
  imshow("source", src);

  if( !src.data )
{ return -1; }
   GaussianBlur( src, src, Size( 9, 9 ), 0, 0 );
  imshow("after", src);

as the possiblities of not totally smooth the final tally of the data looks feasible to filter only two more values to get both peaks as i had informed earlier which i had been tried to work on the code - failing :( .. still trying now

zms gravatar imagezms ( 2016-05-16 23:07:16 -0600 )edit

ok got it

int peakHigh=0;
int peakLow=0;
int peakHighIndex=0;
int peakLowIndex=0;

for (int i=1; i<256-1;++i) 
{ if(histoheight[i]>histoheight[i-1] && histoheight[i]>histoheight[i+1])
{ 
 cout << "Peak Index: " <<i << " Peak Value: " <<histoheight[i] <<endl;

 if( histoheight[i] > peakLow && i > peakLowIndex )
     {
    peakLow = histoheight[i];
    peakLowIndex = i;
     }
     else //if( histoheight[i] > peakLow && i > peakLowIndex )
     {
    peakHigh = histoheight[i];
    peakHighIndex = i;
     }
}
else
{}
}
 cout << "PeakLow at position: " << peakLowIndex << endl;
 cout << "PeakLow Value: " << peakLow << endl;
 cout << "PeakHigh at position: " << peakHighIndex << endl;
 cout << "PeakHigh Value: " << peakHigh << endl;
zms gravatar imagezms ( 2016-05-17 00:04:40 -0600 )edit

@zms you have to smooth the histogram not the image . Check my new answer

pklab gravatar imagepklab ( 2016-05-17 06:27:35 -0600 )edit

@pklab .. thanks for the shared codes. Anyway i had tried it but get error. Do u know how to fix this? as i had include the math.h

1>  main.cpp
1>main.cpp(66): error C2668: 'pow' : ambiguous call to overloaded function
zms gravatar imagezms ( 2016-05-18 03:19:23 -0600 )edit

@zms use std::pow((int)2, numBins); to solve. This is pure C++ issue... a bit of effort, please

pklab gravatar imagepklab ( 2016-05-18 10:57:30 -0600 )edit

@pklab, I'm sorry about that, but actually i had checked it my code and i had put this in the beginning

#include <math.h>

using namespace cv;
using namespace std;

Yet, the result is the same. And i did google the potential issue http://www.cplusplus.com/forum/window...

and I'm using MS2010. So, is there something wrong here? I'm sorry have to ask again because I did checked something on this and yet not succeded.

Thanks

zms gravatar imagezms ( 2016-05-24 06:56:11 -0600 )edit

@zmserror C2668: 'pow' ... is related to C++ ! using namespace specifier and full typing cast with the function calls should solve ambiguities.

BTW pow is not mandatory here. To understand the code you can remove pow and use fixed histSize such as 16 or 32, or 64 or 128 or 256

pklab gravatar imagepklab ( 2016-05-24 09:02:56 -0600 )edit

got it @pklab! :) thanks so much.. it is working now and I'll check the code to understand further.

Thanks again

zms gravatar imagezms ( 2016-05-26 08:03:26 -0600 )edit

Question Tools

1 follower

Stats

Asked: 2016-05-16 03:20:17 -0600

Seen: 6,400 times

Last updated: May 17 '16