This forum is disabled, please visit https://forum.opencv.org
 | 1 | initial version |
There is a plot module in the OpenCV Contrib modules. The documentation for that is HERE.
There are no samples, and very little documentation. It seems to be pretty simple, with no labels on the grid-lines. I don't know if you can plot multiple data sets on the same graph, but if you set the min/max and plot size to the same values, you should be able to do a bitwise_xor to combine them.
Basically, it looks like you do something like this: The data must be in double format, or it calls exit(0), which is stupid, it should use CVAssert like everything else, and I think it can handle float just fine with a little work. Also, remember that +Y is down. So
Mat xData, yData, display;
Ptr<plot::Plot2d> plot;
xData.create(1, 100, CV_64F);//1 Row, 100 columns, Double
yData.create(1, 100, CV_64F);

for(int i = 0; i<100; ++i)
{
    xData.at<double>(i) = i/10.0;
    yData.at<double>(i) = SQUARE(i/10.0);
}
plot = plot::createPlot2d(xData, yData);
plot->setPlotSize(100, 1000);
plot->setMaxX(10);
plot->setMinX(0);
plot->setMaxY(100);
plot->setMinY(-1);
plot->render(display);
imshow("Plot", display);
waitKey();
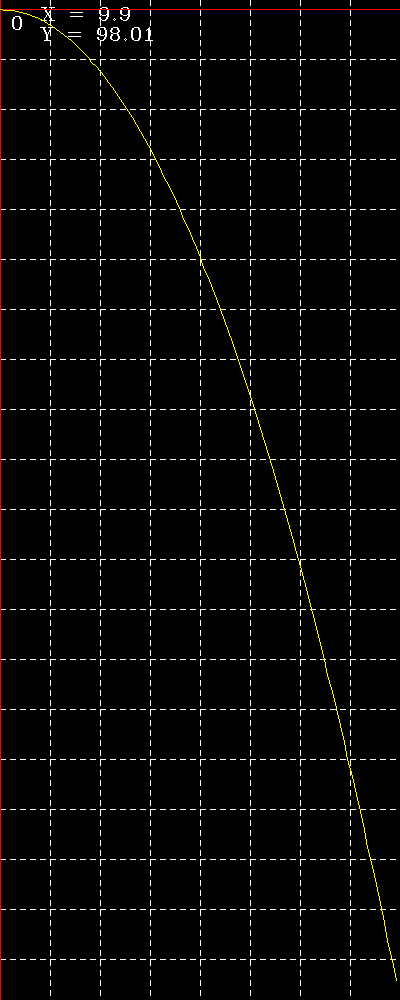
produces

Not very intuitive. But you can draw on this image just like any other image, with text, circles, rectangles and lines.